 Important info about this support page
This knowledge base article refers to the Dragonfly Cloud Dashboard. The Dragonfly Cloud Dashboard is NOT the Dragonfly Web User Interface that is used to manage the Dragonfly App.
The Dragonfly Cloud Dashboard is a powerful administration tool based on Javascript, CSS and HTML that can be used to access, manipulate and monitor a set of resources registered with your Dragonfly site without having to call the Dragonfly Cloud Server resources API. This is the list of resources that can be managed via the dashboard: user accounts, site, levels, floor plans, geo-fences, devices, VISUAL markers.
Login
Access the Dragonfly Cloud Dashboard at at this link and follow the instructions on the login screen. Please supply the credentials contained in the Onit Activation email and press the Login button.
General
Accounts
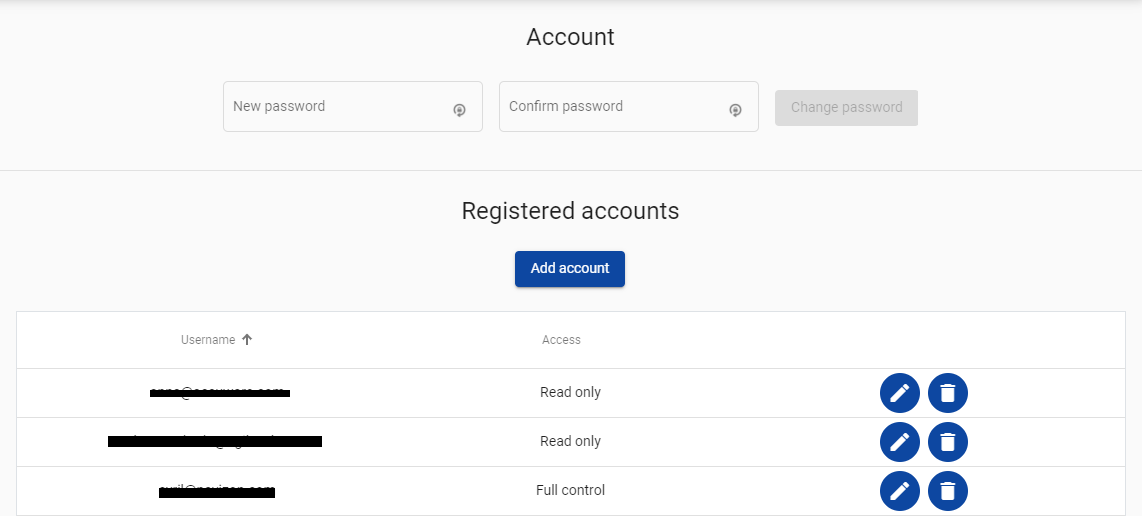
This page enables the management of the accounts that are allowed to access the Dragonfly Cloud Dashboard (and allowed to call the Dragonfly Cloud API):
Account – allows the assignment of a new password for the account currently logged in.
Registered Accounts – gives a list of accounts currently registered in the site and allows to change the access level of a specific account (see below) or to Delete a specific account.
To create a new account you simply need to:
- Click on the Add account button.
- Insert the email address of the account.
- Choose the access level for the new account (see below more info about the access levels).
- Click on Save. Be aware that the initial password for new accounts will be EMPTY and new users will be able to change their password under the General > Accounts page after the first login.

More info about the access levels can be found inside this page.
Site
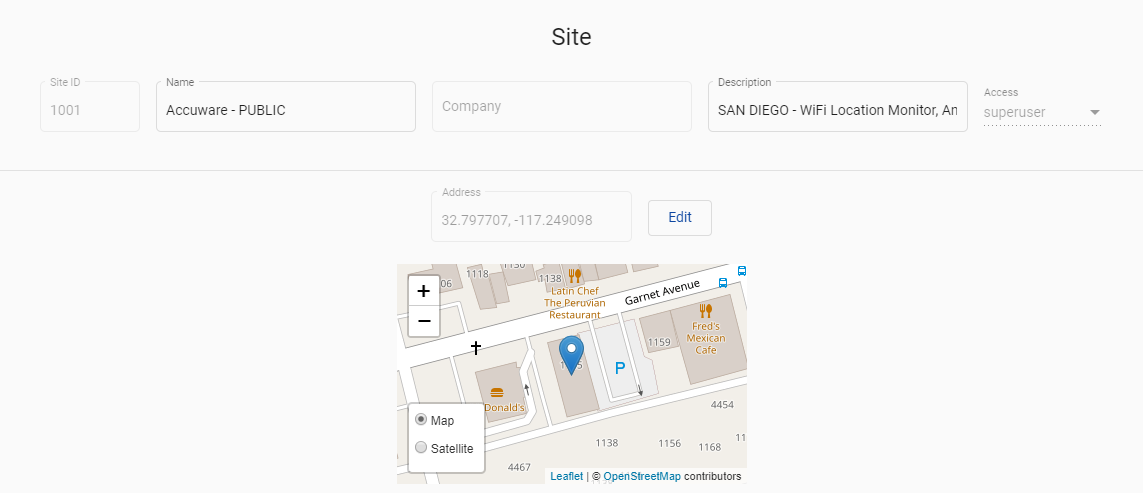
Site – summarizes and lets you change basic information of the site.
- Site ID – your unique site identification.
- Name – your custom site name.
- Description – the expiration date of the license(s) of that site along with the number of devices allowed.
- Access – this is the access level associated with your account.
- Address – these coordinates allows to focus the Map on the area of interest.
Levels
This page enables you to manage the logical levels associated with a specific site. Use the levels mechanism to divide floor plans based on:
- their vertical positions (e.g. different floors of the same building).
- or their different locations (e.g. different buildings of the same complex or different buildings of different complexes).
You can create more levels (and later, add only one floor plan to each level) by following these steps:
- Click on the Create new level button.
- Select a Level ID for the new level.
- (OPTIONAL) insert a Name and a Description.
- Click on Create.
You can also Edit the information associated to each level or Delete a level by using the buttons on the right side of the table.

- For each Site you will find the default level with Level ID 0. This level can not be eliminated.
- Using the Dragonfly Cloud Dashboard it is possible to create up to 30 Levels (in addition to Level 0). Additional levels can be created using this API call.
Floor Plans
This page enables the management of the floor plan(s) associated with each logical level of a site.
To upload a new floor plan please follow the step by step guide at this link.
You can also View a floor plan, Edit the information associated to a floor plan or Delete a floor plan by using the buttons on the right side of the table.
Geo-fences
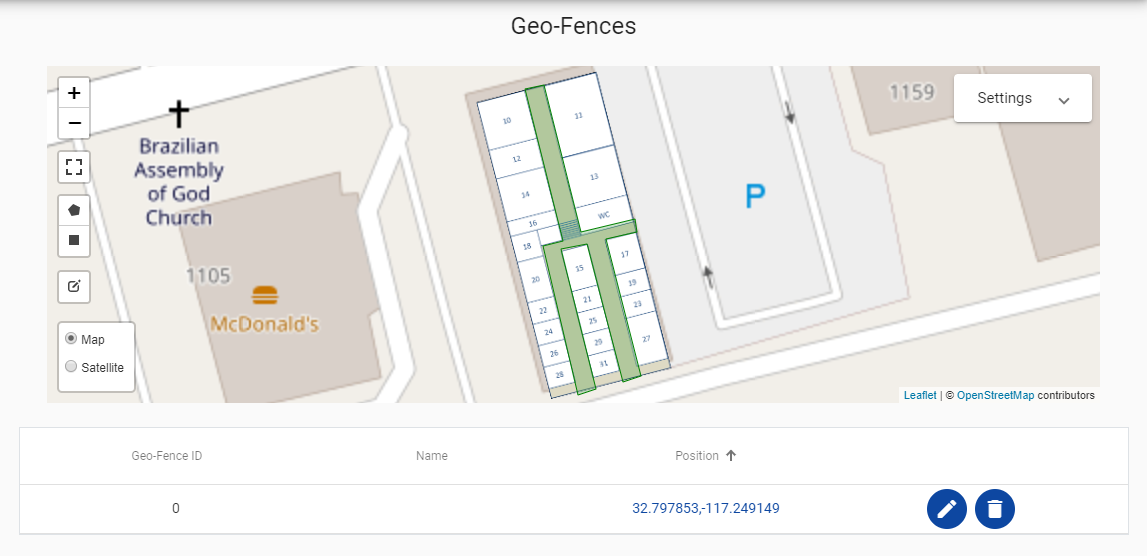
This page enables the management of the geo-fences associated to the levels of your site. Geo-fences are virtual polygons (made of multiple vertexes) used in order to divide a floor plan into multiple areas allowing afterwards to retrieve the sub area in which each one of the devices is located.
To create a geo-fence:
- Select the level of interest using the drop-down menu in the top-right corner of the dashboard.
- Chose the polygon or the rectangle from the left menu and click on the map to define the first vertex of the geo-fence.
- Click on the map to define the geo-fence (each geo-fence can contain an unlimited number of vertexes). At the end click on the first vertex to close the geo-fence. Assign a name to the geo-fence and choose if the geo-fence created is an INCLUDE or EXCLUDE area. Click on Create.
- The geo-fence has been created and an ID has been assigned to it.
To modify the geo-fences shapes:
- Click on the edit button on the left side of the map.
- Modify the geo-fences vertexes.
- Click on the Save button.
In order to delete a geo-fence click on the Trash button available inside the table with the list of geo-fences.
Settings
This page enables the management of the settings related to the Dragonfly > History page. There are 2 areas:
History display measure units
- Duration – the measurement unit for the Duration column (hour:minute:second, day:hour:minute:second, Minutes, Percent)
- Distance – the type of measurement unit used for the distances (Meter, Kilometer, Foot, Mile)
- Speed – the type of measurement unit used for the speed (Km/h, Mph, m/s)
- Time zone – the time zone of the specific venue.
History calculation thresholds
- The threshold in seconds after which:
- a Dragonfly device is considered as stopped.
- a Dragonfly device is considered as offline.
Dragonfly
Map
The upload of the positions must be activated inside the Dragonfly Web User Interface
To activate the upload of the positions you need to:
- Launch the Dragonfly App.
- Click on the CONFIGURATION tab > ADVANCED SETTINGS.
- Set the Position upload interval to a value above 1000 ms.
- Click on the Save Config and Restart button.
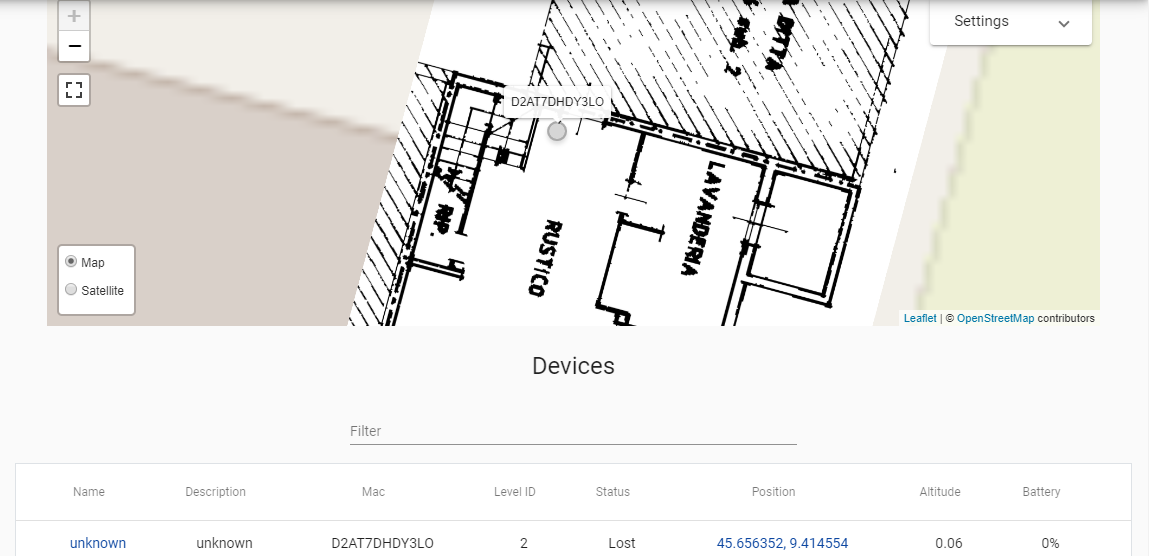
Dragonfly Map – this section of the page shows the position(s) of all device(s) that are making use of the Dragonfly App (and for which the upload of the position is active).
Inside the map you will see:
-
- GREEN dots – devices in NAVIGATION status (the Dragonfly App is computing the positions and is sending them to the Dragonfly Cloud Dashboard).
- RED dots – devices in LOST status (the Dragonfly App is NOT computing the positions even if it is communicating with the Dragonfly Cloud Dashboard).
- GREY dots – Dragonfly devices whose positions was received by the Dragonfly Cloud Dashboard more than 15 seconds ago (the Dragonfly App is not running anymore on those devices or there are problems with the Internet connection).
- In the left corner of the map there is a button to enlarge the Map to full screen.
- Inside the top right corner of the dashboard there is a drop-down menu that allows to select the level, if you have multiple levels.
Devices – this section of the page shows the list of all the devices that have been seen at least once, along with the following information:
| Element | Description |
|---|---|
| Name | the optional name automatically assigned by Dragonfly or assigned manually using the Edit button under the Action column. |
| Description | the optional description automatically assigned by Dragonfly or assigned manually using the Edit button under the Action column. |
| Mac | the device unique ID generated by Dragonfly. This ID contains a total of 12 characters beginning with a “D”. |
| Level ID | the level on which the device is located. |
| Status | NAVIGATION (if Dragonfly can compute the position of the device) or LOST (if Dragonfly can’t compute the position of the device). |
| Position | the last position computed by Dragonfly. It is possible to center the map to the position of the device by clicking on the Go To Position button (the blue icon near the coordinates). |
| Altitude | the altitude of the device. |
| Battery | not relevant. |
| Last Seen | the last time the device running Dragonfly has been in touch with the Dragonfly Cloud Dashboard. |
| ACTION icon |
|
History
The storage of the historical positions must be activated inside the Dragonfly Web User Interface
To activate the storage of the historical positions you need to:
- Launch the Dragonfly App.
- Click on the CONFIGURATION tab > ADVANCED SETTINGS.
- Enable the Position upload store.
- Set Position upload interval to a value above 1000 ms.
- Click on the Save Config and Restart button at the bottom of the page.
Inside this page of the Dragonfly Cloud Dashboard you can view and export very useful data related to your Dragonfly devices.
Search area
 The top right area of the page is the time filter. It allows to filter all data received by the Dragonfly Cloud Server and display data related to:
- 1 specific day
- a specific time-window (made up of multiple days).
Please remember that:
- Green dates: are with available data.
- Red dates: are with no data.
Be aware that the START TIME refers to the START DATE, while the END TIME refers to the END DATE!
The 3 LINES MENU button (next to the SEARCH button) allows to:
- Filter based on level – when enabled the level (next to the LOGOUT button) will be taken into account during the search process. When disabled data will be shown regardless of the selected level.
- Delete Selected dates – Delete data related to the chosen time-window saved inside the Dragonfly Cloud Server – This action is irreversible!
- Delete All the data – Delete ALL the data saved inside the Dragonfly Cloud Server – This action is irreversible!
- Csv Export – download data related to the chosen time-window.
The search might take a while depending on the amount of data to be retrieved and the speed of your Internet connection!
Results area
 Once your data has been retrieved, below the search area you will see a table with all the device that sent data to the Dragonfly Cloud Server for the selected time-window. This table shows:
- a color – this is the color used to represent your data in the left VISUALIZATION area (discussed below). You can change the color by clicking on it.
- a toggle switch – to enabled/disable the visualization of data in the left VISUALIZATION area (discussed below)
- Driving – this column shows the total time a device has been seen as moving.
- Turned off – this column shows the total time a device has been seen as turned off. The thresholds above which a device is considered as STOPPED or OFFLINE can be set inside the GENERAL > SETTINGS page of the Dragonfly Cloud Dashboard.
- Distance – this column shows the total distance traveled by the device.
- Max speed – this column shows the maximum speed reached by the device .
- Average speed – this column shows the average speed traveled by the device.
- Details button – allows to show detailed data related to each drive/travel made by a specific device.
- CSV Export button – allows to download data related to each drive/travel for that specific device.
Visualization area
 Once your data has been retrieved, the left side area of the page (the one with the map) will allow you to view some interesting info about your Dragonfly devices. Please remember that the historical positions recorded are the exact same positions shown live under Dragonfly > Map.
By clicking on the GEAR button it is possible to change the type of data displayed:
- Line (default) – these are spaghetti lines where the color of the line is different for each one of the Dragonfly devices listed.
- Heatmaps – the color of the area is function of the amount of time a device lingered in that specific area (the higher the amount of time lingered – the hotter the color).
- Line height – these are spaghetti lines where the color of the line is function of the altitude (the higher the altitude – the hotter the line color).
- Timeline – if you chose this option you will be able to see the creation of the spaghetti diagram over time. A toolbar will allow you to speedup the creation process. By enabling the FOLLOW checkbox, the map will automatically stay focused on the Dragonfly device.
By clicking on the CHART button it is possible to switch to another view where your data is displayed in the form of bar/pie charts (using the CHART TYPE menu).
- Duration in time range – shows a bar chart with the amount of time the device has been seen moving (DRIVING), or OFFLINE, or STOPPED. The thresholds above which a device is considered as STOPPED or OFFLINE can be set inside the GENERAL > SETTINGS page of the Dragonfly Cloud Dashboard.
- Duration percent – shows a bar chart with the percentage of time the device has been seen DRIVING or OFFLINE or STOPPED over the whole time windows. The thresholds above which a device is considered as STOPPED or OFFLINE can be set inside the GENERAL > SETTINGS page of the Dragonfly Cloud Dashboard.
- Duration pie-chart – shows a pie chart with the percentage of time each device has been seen as DRIVING over the total time all the devices have been seen as DRIVING
- Distance pie-chart – shows a pie chart with the percentage of distance covered by each device over the total distance covered by all the devices
- Duration bar-chart – shows a bar chart with the amount of time a device has been seen moving (DRIVING).
- Distance bar-chart – shows a bar chart with the distances traveled by each device.
- Maximum speed bar-chart – shows a bar chart with the maximum speed reached by each device.
- Average speed bar-chart – shows a bar chart with the average speed traveled by each device.
Those charts can be all exported using a set of tools that appear while hovering the cursor on the chart.
On the left side of the Map you can Draw a Polygon or a Rectangle to limit the search area geographically, to inspect it closer.
Marking
THIS METHOD TO SET THE MARKERS IS NO LONGER VALID – THIS METHOD TO SET THE MARKERS IS NO LONGER VALID
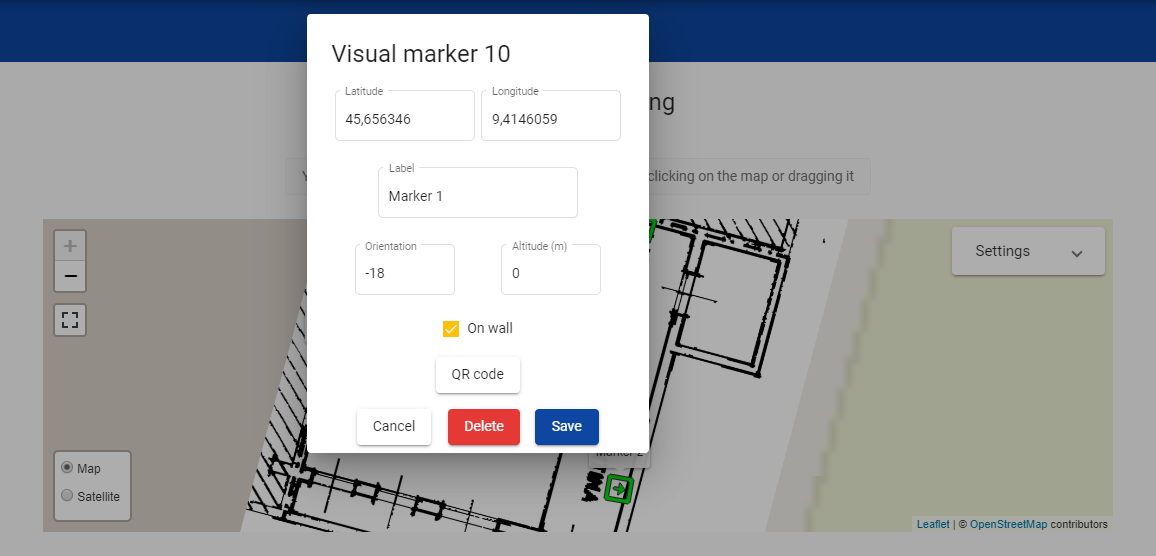
This page allows the management of the VISUAL markers associated to each level of your site. It is possible to:
- Add a marker – following the instructions inside this page.
- Clicking on a VISUAL marker you can:
- Show and Print the VISUAL marker.
- Modify the VISUAL marker position, label, altitude and orientation.
- Delete the VISUAL marker.
License
This page allows you to view and manage the license currently active for your site.
Dragonfly License – this section of the page shows the expiration date and the maximum number of Dragonfly instances allowed by the license linked to your site.
Registered devices – inside this table you can see the list of instances of the Dragonfly App that have been used inside your site.
For each Dragonfly instance you can see:
- Device ID – the unique ID generated for the instance. This Device ID is a pseudo MAC address composed of 12 characters and beginning with a “D”.
- Last authentication date – the timestamp related to the last activity of the instance.

If the number of Dragonfly instances is equal to the maximum number of instances allowed by your license, you can remove one of the Dragonfly instances from the Registered Device table (at this link). Anyway, for security reasons, be aware that you can NOT un-register more than 1 Dragonfly instance per day!
